Comparison of the distribution of steps in the rationale for existing benchmarks. Notably, the distributions for MMMU and VCR overlap.
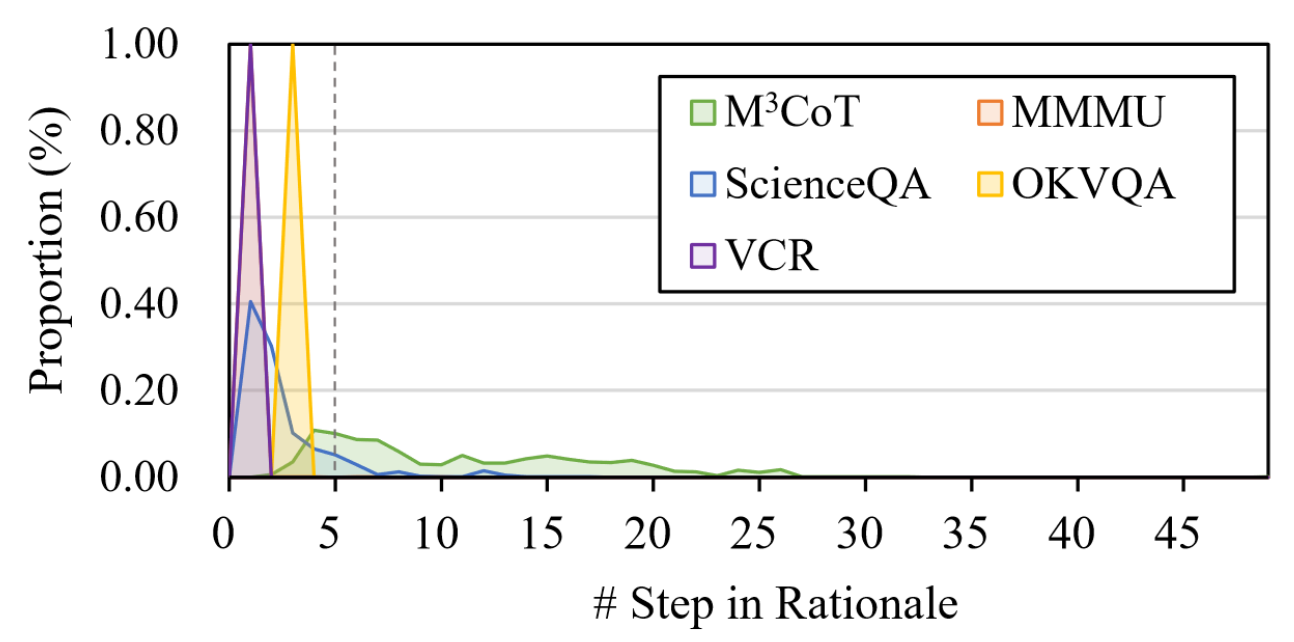
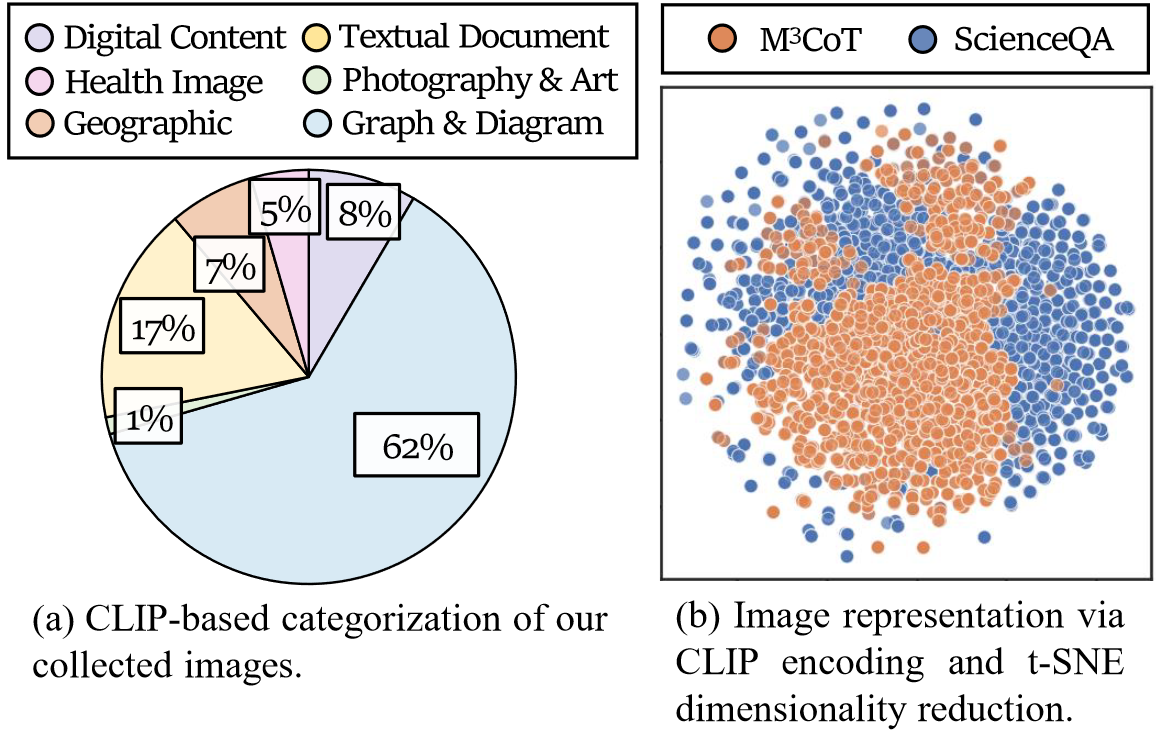
Image diversity analysis (a) and the representation comparison (b) between M3CoT and ScienceQA, where the point area in Figure (b) represents the image semantics coverage in the semantic space.
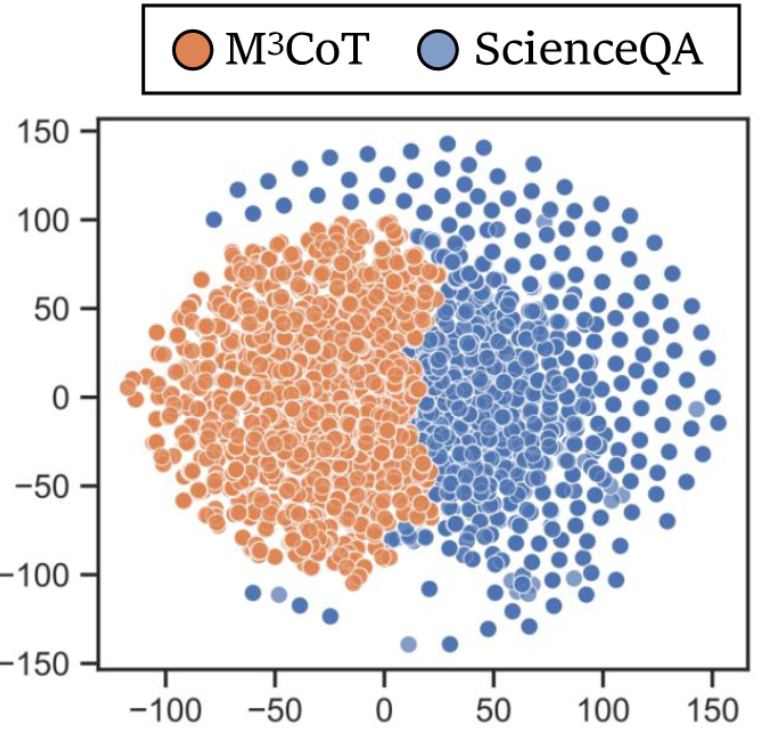
Representation of rationale in two datasets via RoBERTa encoding and tSNE dimensionality reduction.
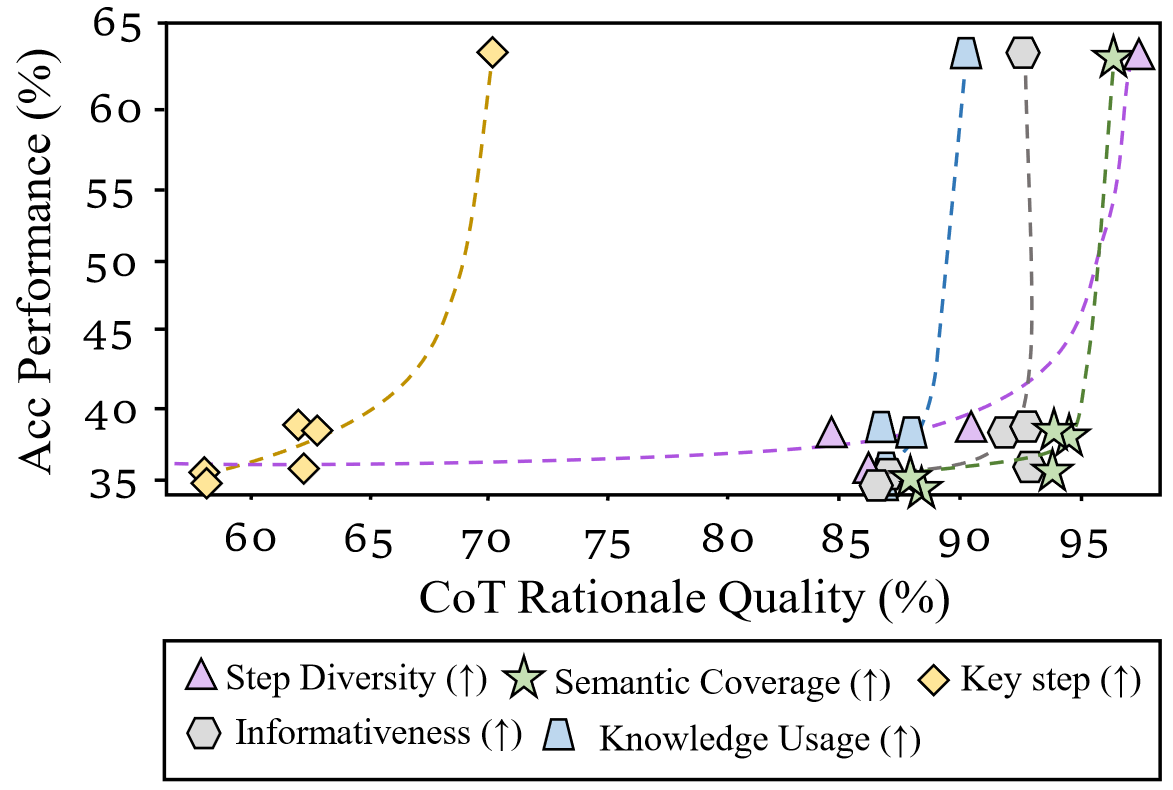
Analysis of the correlation between multidimensional qualities for model-generated rationale and final accuracy performance. The rationale qualities are computed by ROSCOE.